- State of the Screens
- Posts
- What People Really Watch on TV in 2025
What People Really Watch on TV in 2025
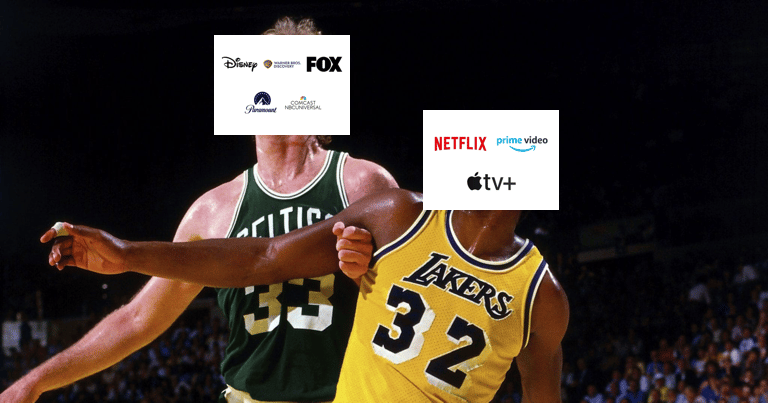
Setting the table: The fall of linear. The rise of streaming. The hollowing out of sports. TV isn’t just changing, it’s collapsing and rebooting at the same time.
Let’s break it down into 4 big questions:
1) Who’s still watching live TV?
2) Is sports the only thing holding linear TV together?
3) What were the most-watched shows?
4) Which streamers are winning the attention war?
Who’s still watching live TV?
Age groups with the largest share of TV time on linear, according to Nielsen:
1) 65+ - 76%
2) 50-64 - 63%
3) 35-49 - 38%
4) 25-34 - 22%
5) 18-24 - 18%
6) 12-17 - 15%
7) 2-11 - 17%
Linear isn’t just declining, it’s aging out. Live TV is mostly for older people now. More than 70% of all TV ads are seen by folks over 55. This isn’t just fragmentation — it’s demographic collapse.
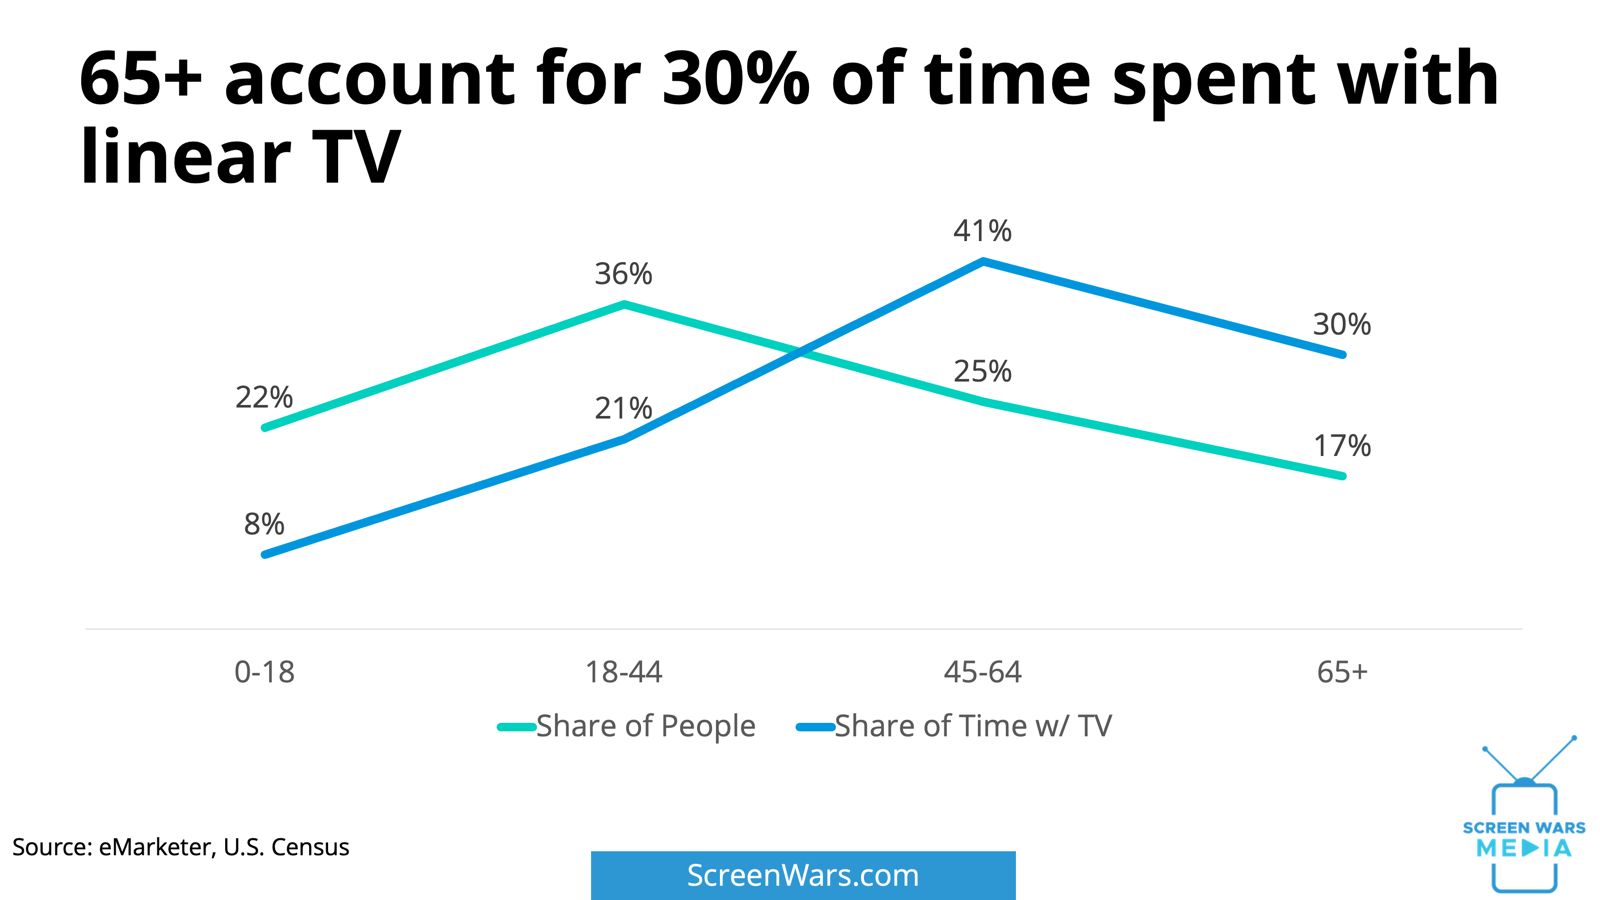
Bottom line: By 2030, streaming will account for the majority of TV ad impressions; however, for younger age demographics (18-54), this shift will occur much sooner.
Is sports the only thing holding linear TV together?
Sports share of linear TV time according to Nielsen:
1) 2021 - 13%
2) 2022 - 15%
3) 2023 - 17%
4) 2024 - 19%
Sports is the biggest draw — but it’s shrinking too. Yes, sports now account for nearly 1 in 5 linear minutes. But that stat is misleading. In absolute terms, far fewer people are watching. For example, compare game 7 of this year’s NBA finals to the same game in 1984.
NBA finals game 7 for 1984 vs. 2025:
1) TV households - ↑ 48%
2) Households watching TV - ↓ 50%
3) Viewership - ↓ 60%
4) Rating - ↓ 60%
5) Share of TVs watching the NBA Finals - ↓ 21%
Yikes: It gets worse when you look at the 18-34 demo. The good news is 71% of the people watching TV were tuned into the NBA Finals. The bad news is that only 6% were watching TV at all, resulting in 4% of 18-34 watching the NBA Finals.
What were the most-watched shows?
Top 10 TV shows of 2024-25 by total viewers, according to Nielsen:
1) Squid Game (Netflix) - 27M
2) Sunday Night Football - (NBC) - 22M
3) Adolescence (Netflix) - 19M
4) Tracker (CBS) - 17M
5) Reacher (Prime Video) - 17M
6) High Potential (ABC) - 16M
7) Matlock (CBS) - 16M
8) Landman (Paramount+) - 16M
9) Monsters: The Lyle & Erik Menendez Story (Netflix) - 16M
10) Zero Day (Netflix) - 16M
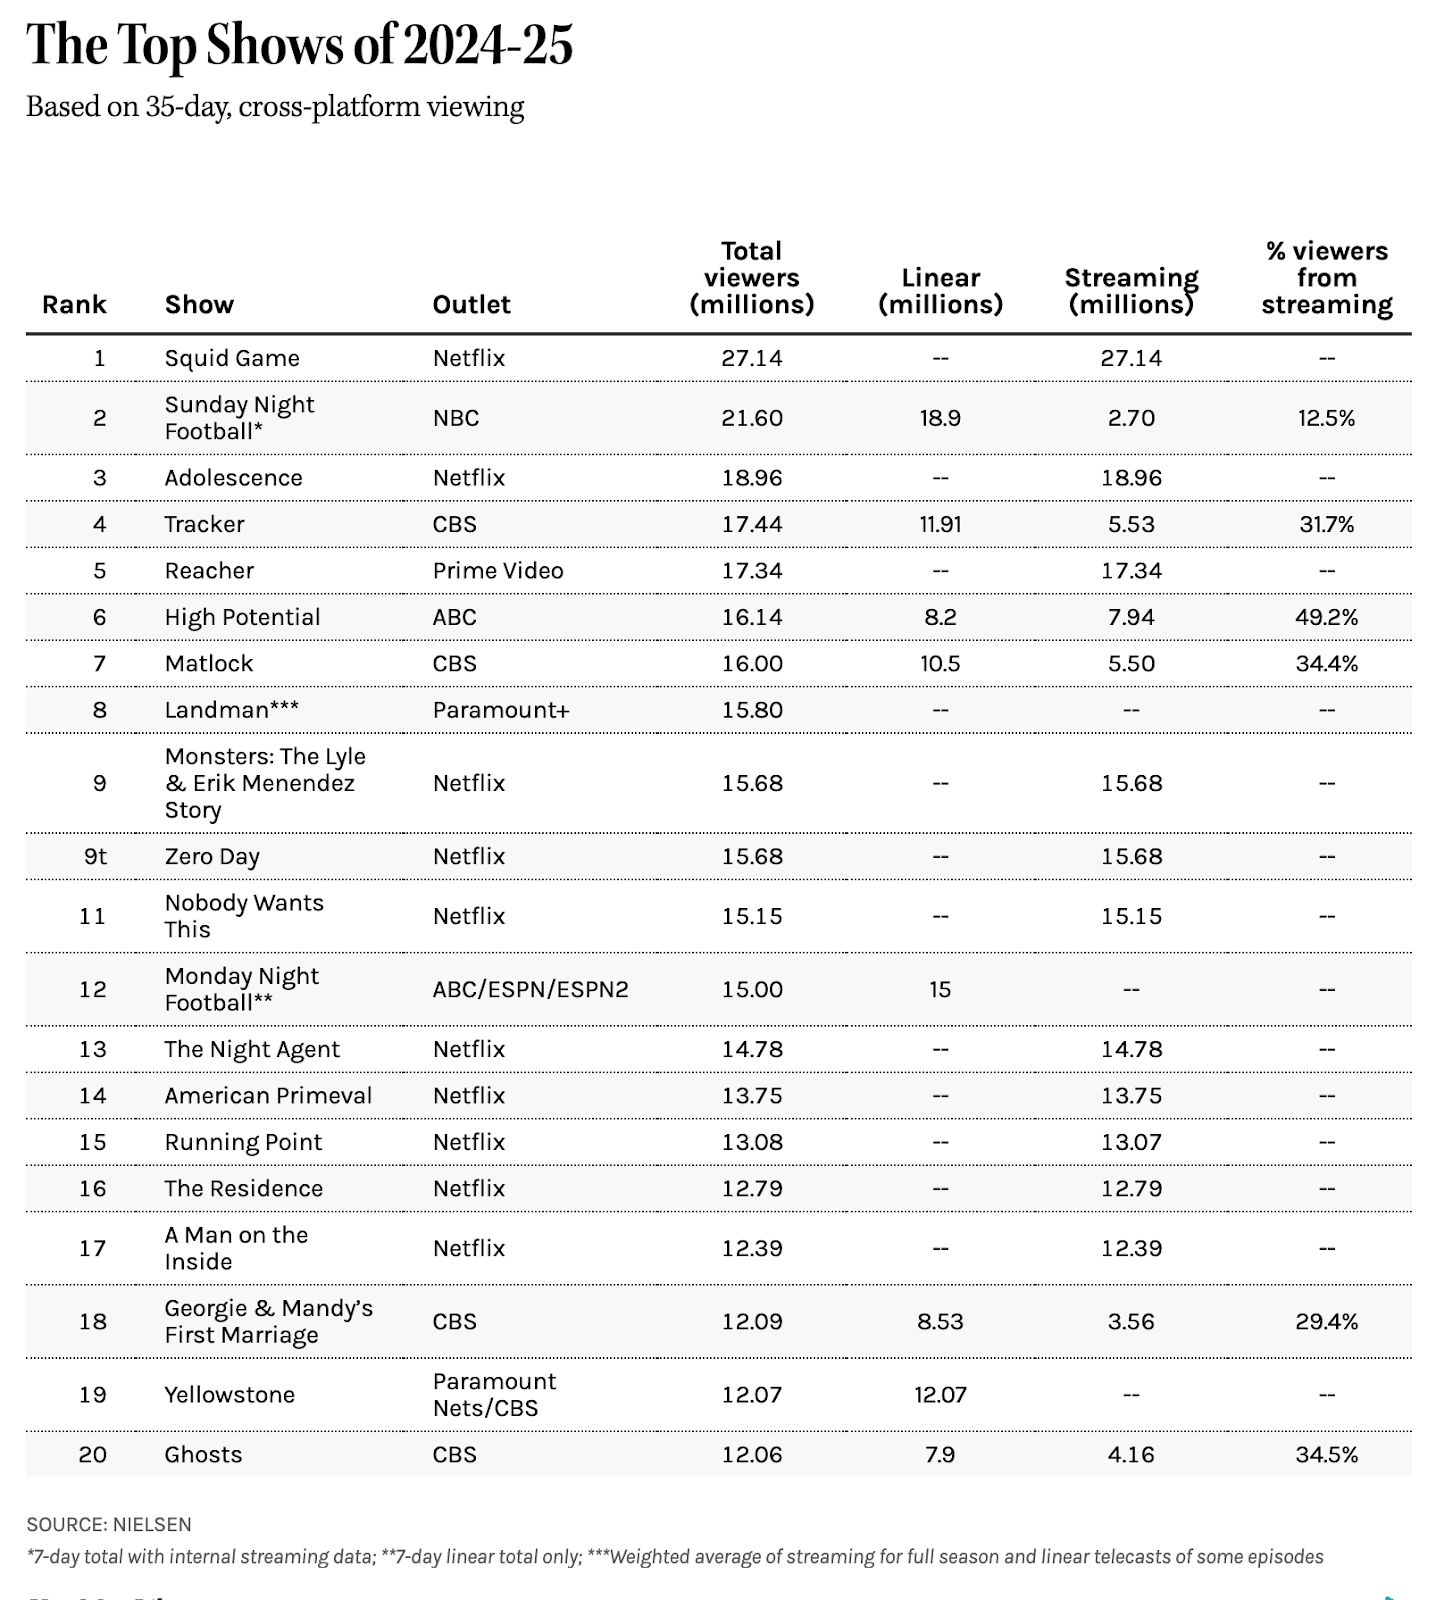
Streaming is winning not just hours, but hits. The top show (Squid Game) beat the top linear program (NFL SNF) by 26%. Netflix accounted for half of the most-watched shows. Importantly, this isn't just long-tail dominance.
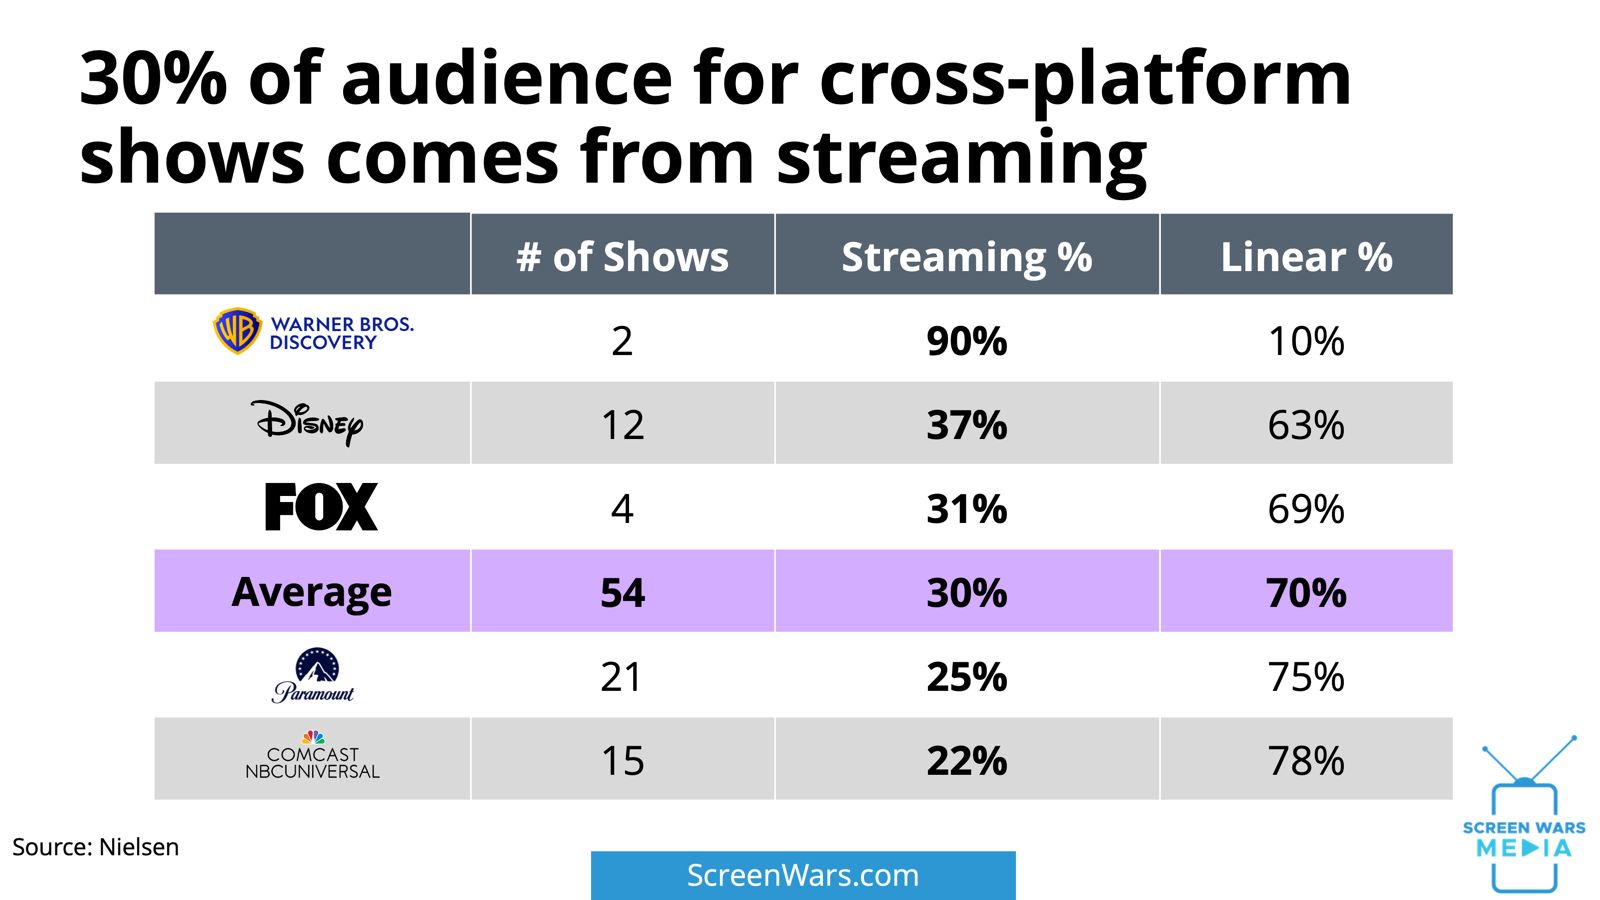
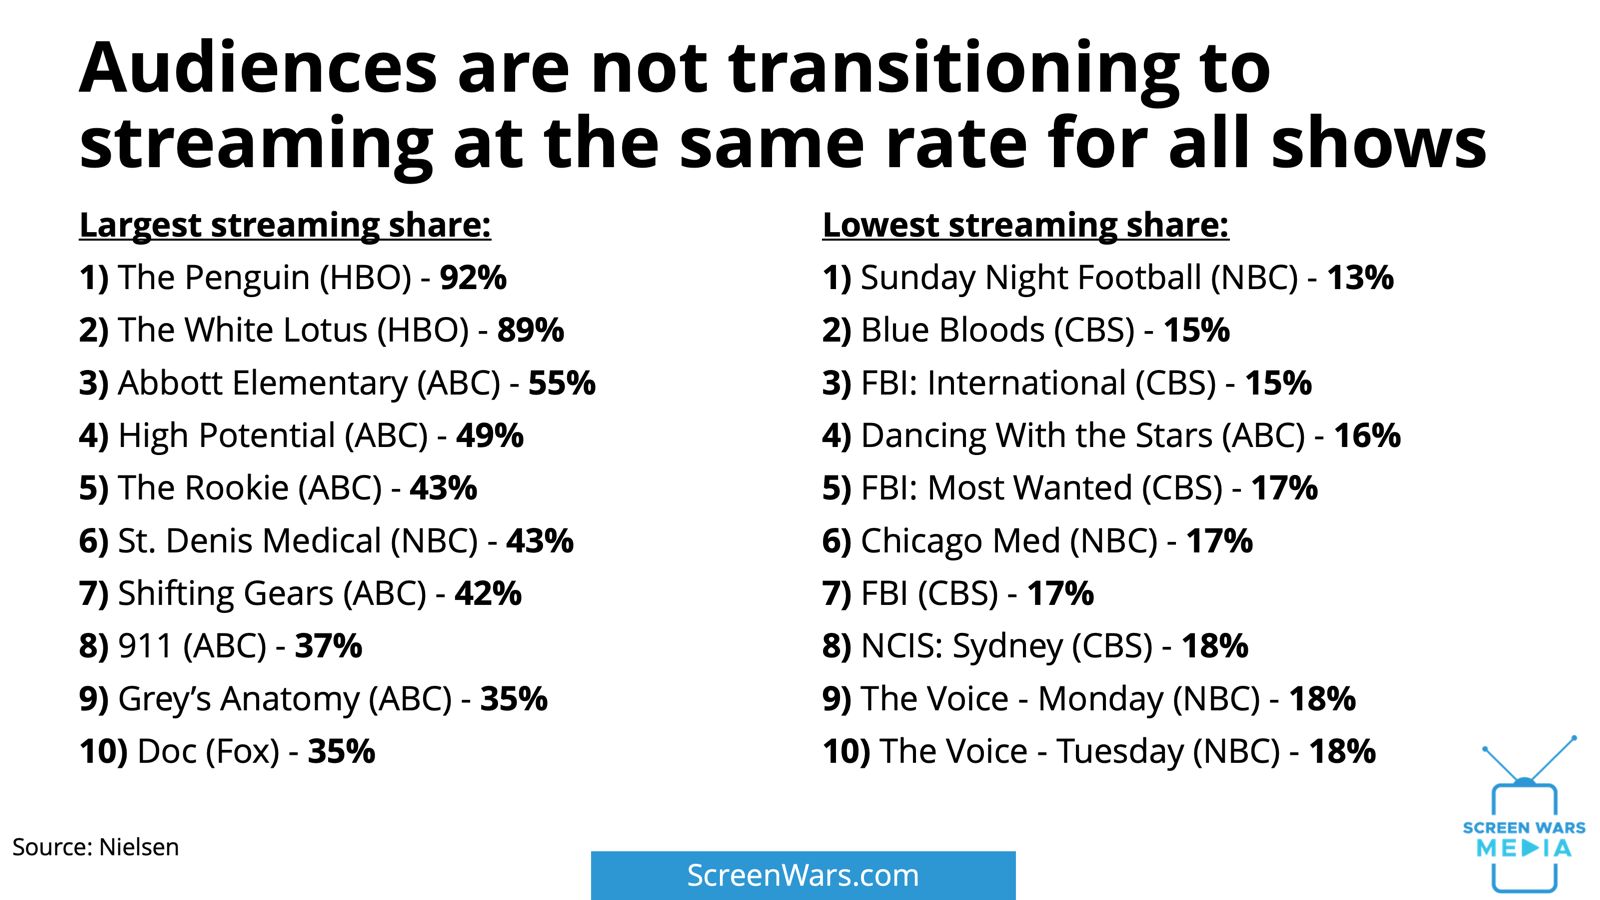
Linear → Streaming: 54 shows ran on both linear and streaming. On average, 30% of the audience came from streaming.
Share of audience from streaming for cross-platform shows:
1) WarnerBros. Discovery - 90%
2) Disney - 37%
3) Fox - 31%
4) Average - 30%
5) Paramount - 25%
6) NBCUniversal - 22%
Largest share from streaming for cross-platform shows:
1) The Penguin (HBO) - 92%
2) The White Lotus (HBO) - 89%
3) Abbott Elementary (ABC) - 55%
4) High Potential ( ABC) - 49%
5) The Rookie (ABC) - 43%
Smallest share from streaming for cross-platform shows:
1) Sunday Night Football (NBC) - 13%
2) Blue Bloods (CBS) - 15%
3) FBI: International (CBS) - 15%
4) Dancing With the Stars (ABC) - 16%
5) FBI: Most Wanted (CBS) - 17%
Which streamers are winning the attention war?
Netflix remains the apex predator. Even as its share of top 10 originals has slipped from 80% to 62%, no one else has cracked consistent hit-making.
Netflix share of Nielsen top 10 originals, according to Entertainment Strategy Guy:
1) 2021 - 80%
2) 2022 - 76%
3) 2023 - 69%
4) 2024 - 62%
What’s next?
The shift to streaming is speeding up:
1) 2025 - More people reachable on streaming than linear TV
2) 2026 - People spend more time on streaming than linear TV ← YOU ARE HERE
3) 2028 - Ad money flips ← 2027?
4) 2030 - Streaming gets more ad impressions than linear TV


Reply