- State of the Screens
- Posts
- TVision Insights: Q3 2018 Report Shows Summer’s Top TV Engagement
TVision Insights: Q3 2018 Report Shows Summer’s Top TV Engagement
Key findings from a recent TVision Insights study.
Commercial attention index by age in 2018-Q3:
1) 55–64–122.3
2) 45–54–102.7
3) 25–34–98.5
4) 18–24–97.9
5) 35–54–94.5
6) 65+ — 93.8
7) <18–90.4
Commercial attention index by gender in 2018-Q3:
1) Female — 103.6
2) Male — 96.4

Top 3 events for attention in 2018-Q3:
1) Macy’s 4th of July Fireworks Spectacular (NBC) — 128.4
2) 70th Primetime Emmy Awards (NBC) — 117.5
3) The 2019 Miss America Competition (ABC) — 112.9
Top 3 broadcast programs for attention in 2018-Q3:
1) Running Wild With Bear Grylls (NBC) — 153.0
2) The 100 (CW) — 151.7
3) Single Parents (ABC) — 147.1
Top 3 cable programs for attention in 2018-Q3:
1) The Great Food Truck Race (Food Network) — 173.5
2) The History of Comedy (CNN) — 170.7
3) Pose (FX) — 161.7
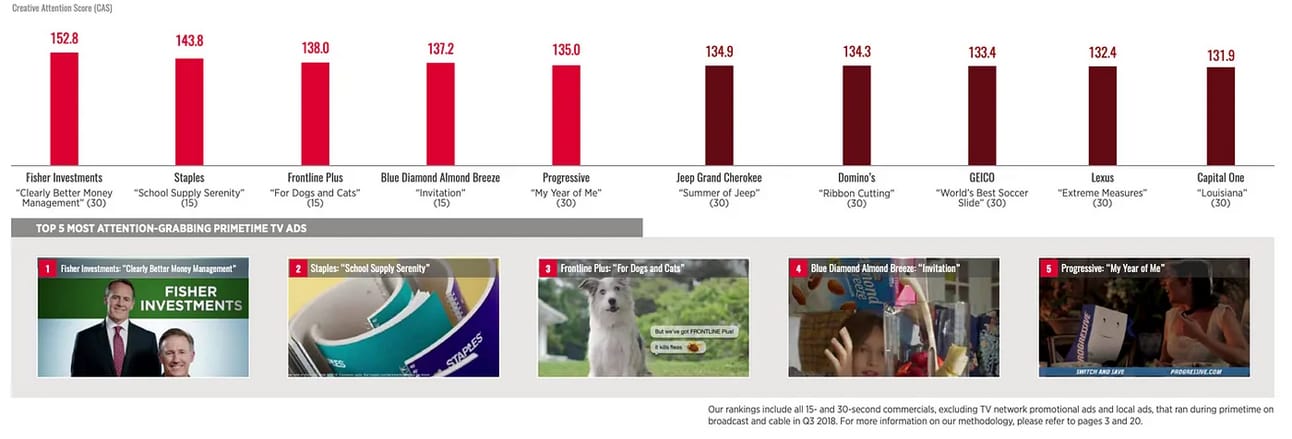
Top 3 ads for attention in 2018-Q3:
1) Clearly Better Money Management (Fisher Investments) –152.8
2) School Supply Serenity (Staples) — 143.8
3) For Dogs and Cats (Frontline Plus) — 138.0

Attention index per second:
1) 6s — 109
2) 30s — 102
3) 15s — 99

The post TVision Insights: Q3 2018 Report Shows Summer’s Top TV Engagement appeared first on Cross Screen Media.
Reply