- State of the Screens
- Posts
- Cable Ads Are Back at 2007 Levels — With No Bottom in Sight.
Cable Ads Are Back at 2007 Levels — With No Bottom in Sight.

Setting the table: In 2007, cable ads were booming. Fox News, ESPN, and HGTV were minting money. Netflix was mailing DVDs.
Fast forward: Cable ad revenue is back at 2007 levels. But this time, momentum is gone. The bundle is shrinking, ad impressions are vanishing, and the safety net is fraying.
Why it matters: ESPN just launched Flagship. Fox is rolling out Fox One. Two of cable’s biggest players aren’t waiting around — they’re already building lifeboats.
Let’s break it down into 5 big questions:
1) How many homes still have pay-TV?
2) Is time spent with pay-TV declining at the same rate as subscribers?
3) How is this hitting ad revenue?
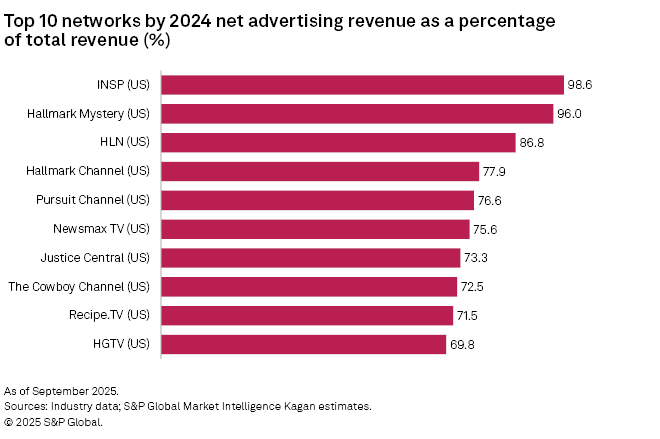
4) Which cable networks are the most dependent on advertising?
5) Which genres are holding up best?
How many homes still have pay-TV?
Quick answer: 68M (51% of U.S. homes)
Pay-TV subscribers (Kagan):
1) Traditional pay-TV - 45.8M (67%)
2) Streaming pay-TV - 22.1M (33%)
3) Total pay-TV - 67.9M

Is time spent with pay-TV declining at the same rate as subscribers?
No. It’s falling almost 3X faster.
Why this matters: Consumers who recently cut the cord watch a lot of TV. This is a bad sign since it leaves a subscriber base filled with people who do not watch a lot of pay-TV.

How is this hitting ad revenue?
Pay-TV advertising revenue (Kagan):
1) 1995 - $4.0B
2) 2005 - $16.2B (↑ 302%)
3) 2015 - $28.0B (↑ 74%)
4) 2025P - $19.1B (↓ 32%)
Pay-TV since 2021:
1) Time spent - ↓ 42%
2) Ad revenue - ↓ 22%
3) Subscribers - ↓ 21%
Bottom line: Fewer subs → Less time → Fewer ad impressions → Lower ad revenue
Which cable networks are the most dependent on advertising?
Networks like HGTV and Newsmax rely on ads for 70%+ of revenue.
Which genres are holding up best?
Pay-TV advertising since 2014 by genre:
1) News - ↑ 44%
2) Sports - ↑ 10%
3) Women’s - ↓ 18%
4) Film - ↓ 19%
5) All pay-TV - ↓ 27%
6) Niche - ↓ 29%
7) Foreign - ↓ 38%
8) General variety - ↓ 40%
9) Arts & entertainment - ↓ 42%
10) Music - ↓ 59%
11) Family - ↓ 66%

This isn’t just a reversion — it’s a structural collapse. Hitting 2007 ad revenue levels might look like a “cycle,” but the ecosystem is fundamentally different now. In 2007, cable was still growing; today, it has no growth engine left. The “floor” is undefined.
What do you think of today's newsletter? |


Reply